GateUser-1cf4ba35
vip
Age0.5Year
Peak Tier0
No content yet
#ADA
🚀 On July 21, ADA strongly broke through the key resistance level of $0.86, igniting bullish sentiment in the market. However, just as it reached new heights, bears quickly counterattacked, leading to selling pressure at high levels.
The current question is: Can the bulls hold onto their gains?
🐻 Bearish pressure: $0.86 becomes the "lifeline" for bulls
Currently, short sellers are making every effort to push the ADA price back below $0.86. If this defense line is broken, the short-term advantage of the bulls will be reversed, and the price may pull back to the 20-day moving average ($0
ADA-3.92%
View Original
  • Reward
  • Comment
  • Share
#DOGE
On July 20th, DOGE broke through the key resistance level of $0.26, instantly warming market sentiment. As the price continues to rise, DOGE seems to be trying to break free from the sideways movement and aim for higher targets.
But the contest between the bulls and bears is far from over.
🐻 Bear Market Counterattack: Focus on the $0.26 Defense Line
The bears are making a full effort to push back, attempting to pull the price below $0.26. If they succeed, aggressive long positions will face the risk of being trapped, and DOGE may subsequently slide, testing the 20-day moving average be
DOGE-4.49%
View Original
post-image
  • Reward
  • Comment
  • Share
#BNB
🚀 On July 22nd, BNB strongly broke through the resistance at $761, and then surged to $794 on July 23rd, seemingly signaling the start of a new round of upward momentum. However, unfortunately, the price failed to stabilize at the high level. For the bulls to continue the upward trend, they must reclaim $794 and hold it! Once successful, BNB is expected to aim for the significant $900 mark.
🟢 Bullish opportunity: Break through 794, target 900!
If the price reclaims $794 and maintains above it, it will signal the resumption of the upward trend, with $900 being the next target. Once it b
BNB-0.76%
View Original
post-image
  • Reward
  • Comment
  • Share
#XRP
🚀 XRP broke through $3.40 strongly on July 17, and buyers not only successfully stood above this key resistance but also firmly held this level! This is not just a simple rise, but a signal for the bulls to turn $3.40 into a "springboard."
📈 Is the upward channel open? The target may aim for $4.86!
As long as the price breaks through $3.66, XRP will start a new round of upward trend again, and $4 is likely just a relay station, with the real target possibly aimed at $4.86! The overall trend still looks strong, and market sentiment is high.
⚠️ Don't ignore short-term risks, RSI has issu
XRP-1.59%
View Original
post-image
  • Reward
  • Comment
  • Share
#SOL
🚀 On July 21, SOL's price soared, breaking through $185 and directly igniting market sentiment. Bulls are attacking the key resistance level of $209. If they can take it down in one go, this wave of market will open up broader upward space!
🔥 Bulls are in full force, targeting $240!
The current trend is very strong. If SOL breaks through 209 USD, then the next stop will be 220 USD, and there is even a chance to surge up to 240 USD! Bulls are trying to turn 185 USD into a new "launching pad"; if they stabilize here, further acceleration is expected.
⚠️ Don't ignore risk signals!
However
SOL-1.3%
View Original
post-image
  • Reward
  • Comment
  • Share
#ETH
🔥 On July 20, ETH strongly broke through the $3745 barrier, seemingly about to kick off a new round of upward momentum, but then suddenly lost steam — the price could not hold steady and quickly retreated, dousing the market with a bucket of cold water.
But don't rush, this doesn't necessarily mean that the market has come to an end; rather, it marks the beginning of another "opportunity game"!
📉 Is a pullback imminent? Two major support levels cannot be ignored.
If ETH falls below $3745, it indicates strong selling pressure at high levels. In the short term, the price may retest:
📍Fi
ETH-0.99%
View Original
  • Reward
  • Comment
  • Share
#BTC
🚀 BTC has recently been like stepping on the gas and the brakes, with buyers firmly holding at $115,000, while shorts are tightly blocking at $120,000. This position has become the main battlefield for bulls and bears!
But don't rush, understanding the trend is the key to seizing opportunities!
✅ Technical indicators show signals: Bulls are dominant!
The 20-day moving average is currently starting to tilt upwards, and the RSI remains firmly in the positive zone, which signals clearly: the path of least resistance is upward!
As long as the buyer breaks through 123218 dollars, BTC is expe
BTC-0.58%
View Original
post-image
  • Reward
  • Comment
  • Share
🧨 ETH got dumped at $3083, and at that time we were still worried about whether it was doomed. To our surprise——long positions directly made a strong reversal and broke through!
Now, ETH has soared to 3153 dollars, and market sentiment has directly heated up!
🔼 Are long positions back? Let's break it down!
Previously, the fall from $3083 was actually short-term buyers taking profits above $3000, somewhat like "locking in gains first." But the support level is strong, let's take a look:
The first key support is $2879, which holds steady; the second support at $2735 didn't have a chance to be
ETH-0.99%
View Original
post-image
  • Reward
  • Comment
  • Share
#ETH
🧠 ETH surged from the 20-day moving average on July 9, and on July 10, it directly shot up above 2879 USD, with the bulls seeming like they had drunk Red Bull!
🟢 Bullish firepower in full swing: Hitting 3400 and 3750 is not a dream!
✅ The 20-day moving average begins to turn upwards
✅ RSI has entered the overbought zone, full fire!
If the price can hold above $2879, the bulls will next challenge:
📈 Small target: 3153 USD
📈 Target: $3400
📈 Big target: $3750!
If this wave really goes up, then it will be the starting signal for a new round of primary upward trend.
🔴 The short position
ETH-0.99%
View Original
  • Reward
  • Comment
  • Share
🧠 BTC had a strong pump on July 10, breaking through the neckline and completing a bullish inverse head and shoulders pattern——this is no small matter; once the pattern is established, it will be heading towards $150,000!
🟢 Bullish perspective: Support turns positive, target aimed straight at 150,000!
Generally speaking, after a breakout pattern, the price may "retest" the neckline. If BTC can strongly rebound from the neckline position, it means —
✅ The neckline has been defended by the bulls as a support level,
✅ The bulls begin to take over the rhythm,
✅ The rise trend continues to surge,
BTC-0.58%
View Original
post-image
post-image
  • Reward
  • Comment
  • Share
#BNB
🟩 On July 5th, BNB rebounded from the 20-day moving average ($652), which is quite unusual—indicating that market sentiment is still good, and the "buy the dip" crowd has already taken action.
🔼 Bullish path: trend is upward, target is clear!
The 20-day moving average is rising + RSI slightly above the midpoint 👉 Bulls have a slight advantage
If it breaks through the resistance level of $665, it will open up room for upward movement:
First stop: $675
Second stop: 698 USD
If it can break through the "bearish stronghold" of $698, the next stop is $732!
If you can catch this wave of inve
BNB-0.76%
View Original
  • Reward
  • Comment
  • Share
#DOGE
🐕 DOGE recently successfully broke through the 20-day moving average ($0.16), which is a strong signal from the bulls – "I’m still alive and want to do something!"
🟢 Bullish path: Is the rhythm of the counterattack starting?
If the bulls hold the 20-day moving average, we can look forward to:
🎯 First target: 50-day moving average ($0.18)
🎯 Second target: $0.21
🎯 Ultimate goal: $0.26
🚀 Once it breaks through $0.21, DOGE may directly switch to FOMO mode, and a short-term rally is not a dream!
🔴 Short Selling Strategy: You go up, I will sell high!
But the shorts are not to be undere
DOGE-4.49%
FOMO-7.53%
View Original
  • Reward
  • Comment
  • Share
#ADA
📈 Currently, ADA is stuck near the 20-day moving average ($0.58), swaying like a tightly stretched rope, where whoever applies force first can directly determine the direction.
🟢 Bullish direction: just a little more firepower, it all depends on these few levels!
If it can strongly break through the 20-day moving average, then the next challenge is:
50-day moving average ($0.64) 👉 The first tough hurdle;
Downtrend line 👉 The true Dark Lord.
🌈 Once the trend line is broken and stabilized, the trend may completely reverse!
In simple terms: Bulls are now like players in a dungeon, they
ADA-3.92%
View Original
  • Reward
  • Comment
  • Share
#SOL
🚀 On July 6, the bulls finally pushed the SOL price above the 20-day moving average ($149), which can be considered a small victory. But the story isn't over yet—it's stuck in front of the 50-day moving average ($154) and is feeling troubled.
🟢 Bullish direction: Just one step away from opening up the upward space!
Don't underestimate this step:
If it breaks through $159, it will take off directly! It will open the door to $168 and $185.
Although there is slight resistance at $168, it's just a "small hurdle". As long as there are enough people (strong buying power), it is very likely t
SOL-1.3%
View Original
  • Reward
  • Comment
  • Share
#ETH
🧭 ETH has been fluctuating between $2735 and $2323 for several days, like a buildup before a big move, no pain, no gain!
🟩 Bullish Scenario: Challenge the resistance zone, target above 2879+
Currently, the bulls are striving to push upwards:
If it can break through $2635, it is likely to challenge $2738;
If this wave can break through the resistance zone of 2738-2879 USD, then it will be a true breakthrough, and the subsequent bullish space will be opened!
But the pressure in this range is considerable, and the army of sellers is on high alert here, making it not so easy to break throu
ETH-0.99%
View Original
  • Reward
  • Comment
  • Share
#BTC
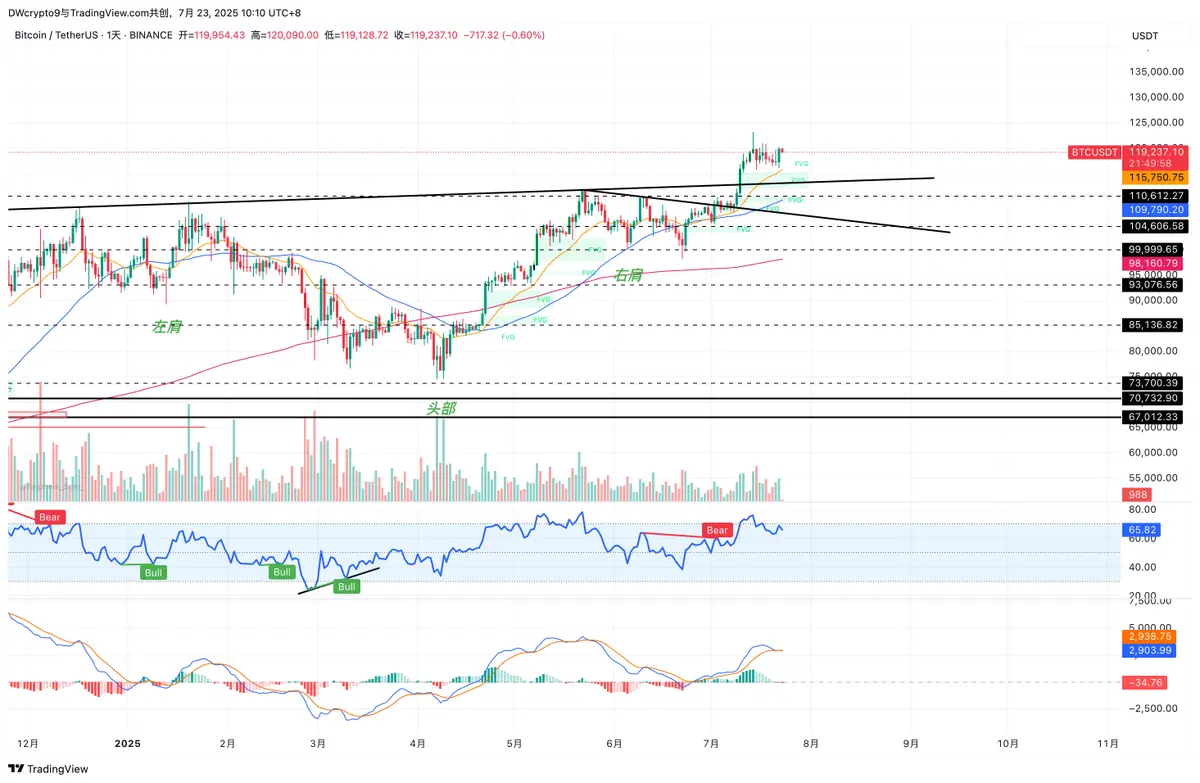
🚨 BTC is currently stuck in a very narrow range:
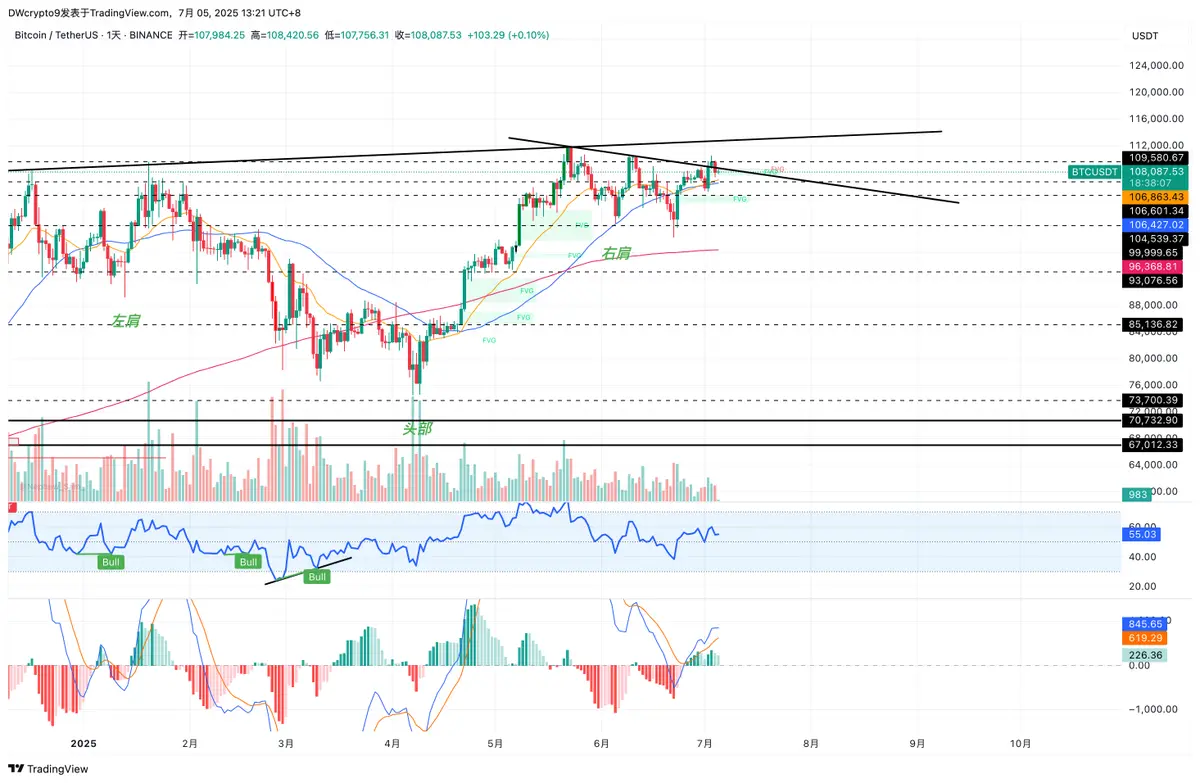
Support below: 20-day moving average ($107,245)
Upper resistance: $110,600
This situation is like a spring compressed to its limit; it would be hard not to explode!
🟥Downside Risk Analysis
If the price breaks below the moving average of 107245 dollars, it indicates that the bulls can’t hold on.
The next stop is 104600 dollars
If it continues to lose ground, it will trigger panic in the market, directly falling back to the psychological barrier of $100,000!
The bears can just wait to see the bulls step on this foot...
🟩Upward Opportunity
BTC-0.58%
View Original
  • Reward
  • Comment
  • Share
#BNB
🔵On July 2, BNB strongly rebounded from the breakout position and briefly broke through the 50-day moving average of $654.
However, the bears quickly organized a counterattack, trying to push the price back below the moving average.
⚠️Key Support and Risks
If BNB breaks below the moving average and falls back into the downward channel, it will be a clear bearish signal, indicating that the market does not trust the previous breakout, and the price may quickly retract to $640.
⚠️Bullish Conditions
Bulls need to hold above the 50-day moving average and push the price to break through $665
BNB-0.76%
View Original
post-image
  • Reward
  • Comment
  • Share
🔵SOL long positions continuously attempted to breach the 159 USD level but failed, resulting in a pullback to below the 20-day moving average at 148 USD.
Currently, the 20-day moving average is flat, and the RSI is slightly below 50, indicating that the forces of bulls and bears are in a stalemate, with supply and demand temporarily balanced.
⚠️Conditions for upward breakout:
If buyers can push SOL strongly above $159, long positions will regain control of the situation.
After the breakthrough, SOL is expected to challenge 168 USD, or even 185 USD, opening up upward space.
⚠️Downside risk:
If
SOL-1.3%
View Original
  • Reward
  • Comment
  • Share
🔵On July 2, LINK briefly broke through the 20-day moving average of 13.32 USD, but the 50-day moving average of 14.09 USD became a roadblock, resulting in long positions returning empty-handed, indicating that short positions were in full force at high levels.
⚠️Key short-term trend:
Currently, LINK is pulling back and there is a risk of dropping towards the key support level of $12.73.
If 12.73 dollars cannot be held, it may trigger a deeper pullback, with a target directly pointing to 11 dollars.
But if the long positions can launch a strong counterattack near $12.73, they will challenge $1
View Original
post-image
  • Reward
  • Comment
  • Share
#BTC
🟢On the 3rd of the month, bulls pulled out all the stops in an attempt to push BTC up to the key resistance of 110,500 dollars, but bears held firm and did not allow the price to stabilize.
⚠️Current trend:
The seller has pushed the price below the downtrend line, which is a clear bearish signal.
Next, the buyer must firmly hold the moving average support, otherwise BTC will head straight for $105,100, and may even test the psychological barrier of $100,000.
🚀Reversal Opportunity:
If the price can rebound strongly from the moving average position, it will release optimistic sentiment!
BTC-0.58%
View Original
post-image
  • Reward
  • Comment
  • Share
  • Topic
    1/3
  • Pin
Trade Crypto Anywhere Anytime
qrCode
Scan to download Gate app
Community
English
  • 简体中文
  • English
  • Tiếng Việt
  • 繁體中文
  • Español
  • Русский
  • Français (Afrique)
  • Português (Portugal)
  • Bahasa Indonesia
  • 日本語
  • بالعربية
  • Українська
  • Português (Brasil)