TrendCatcher
Ethereum
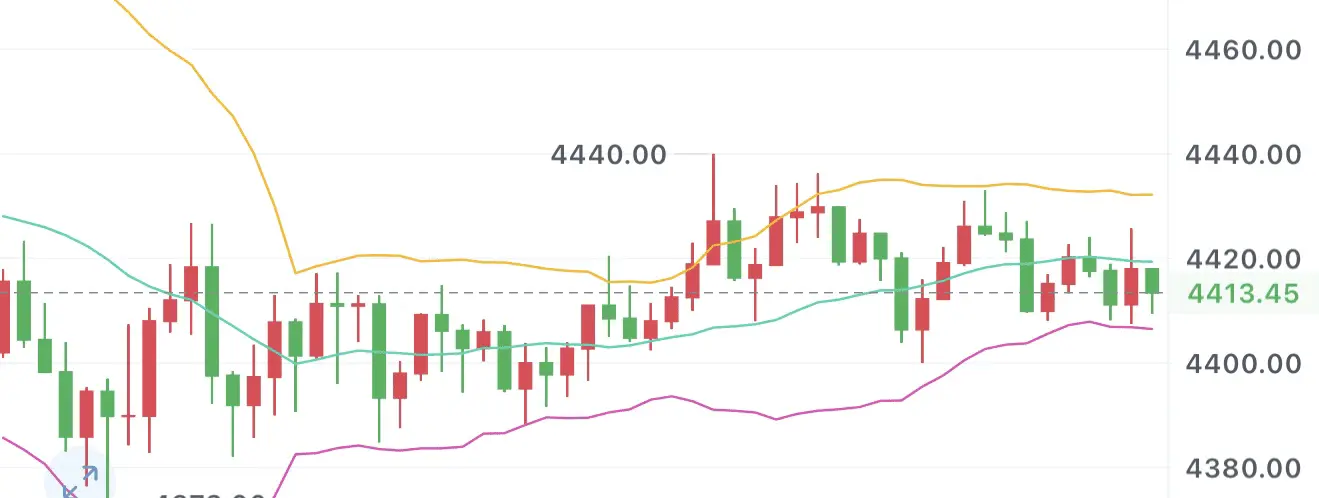
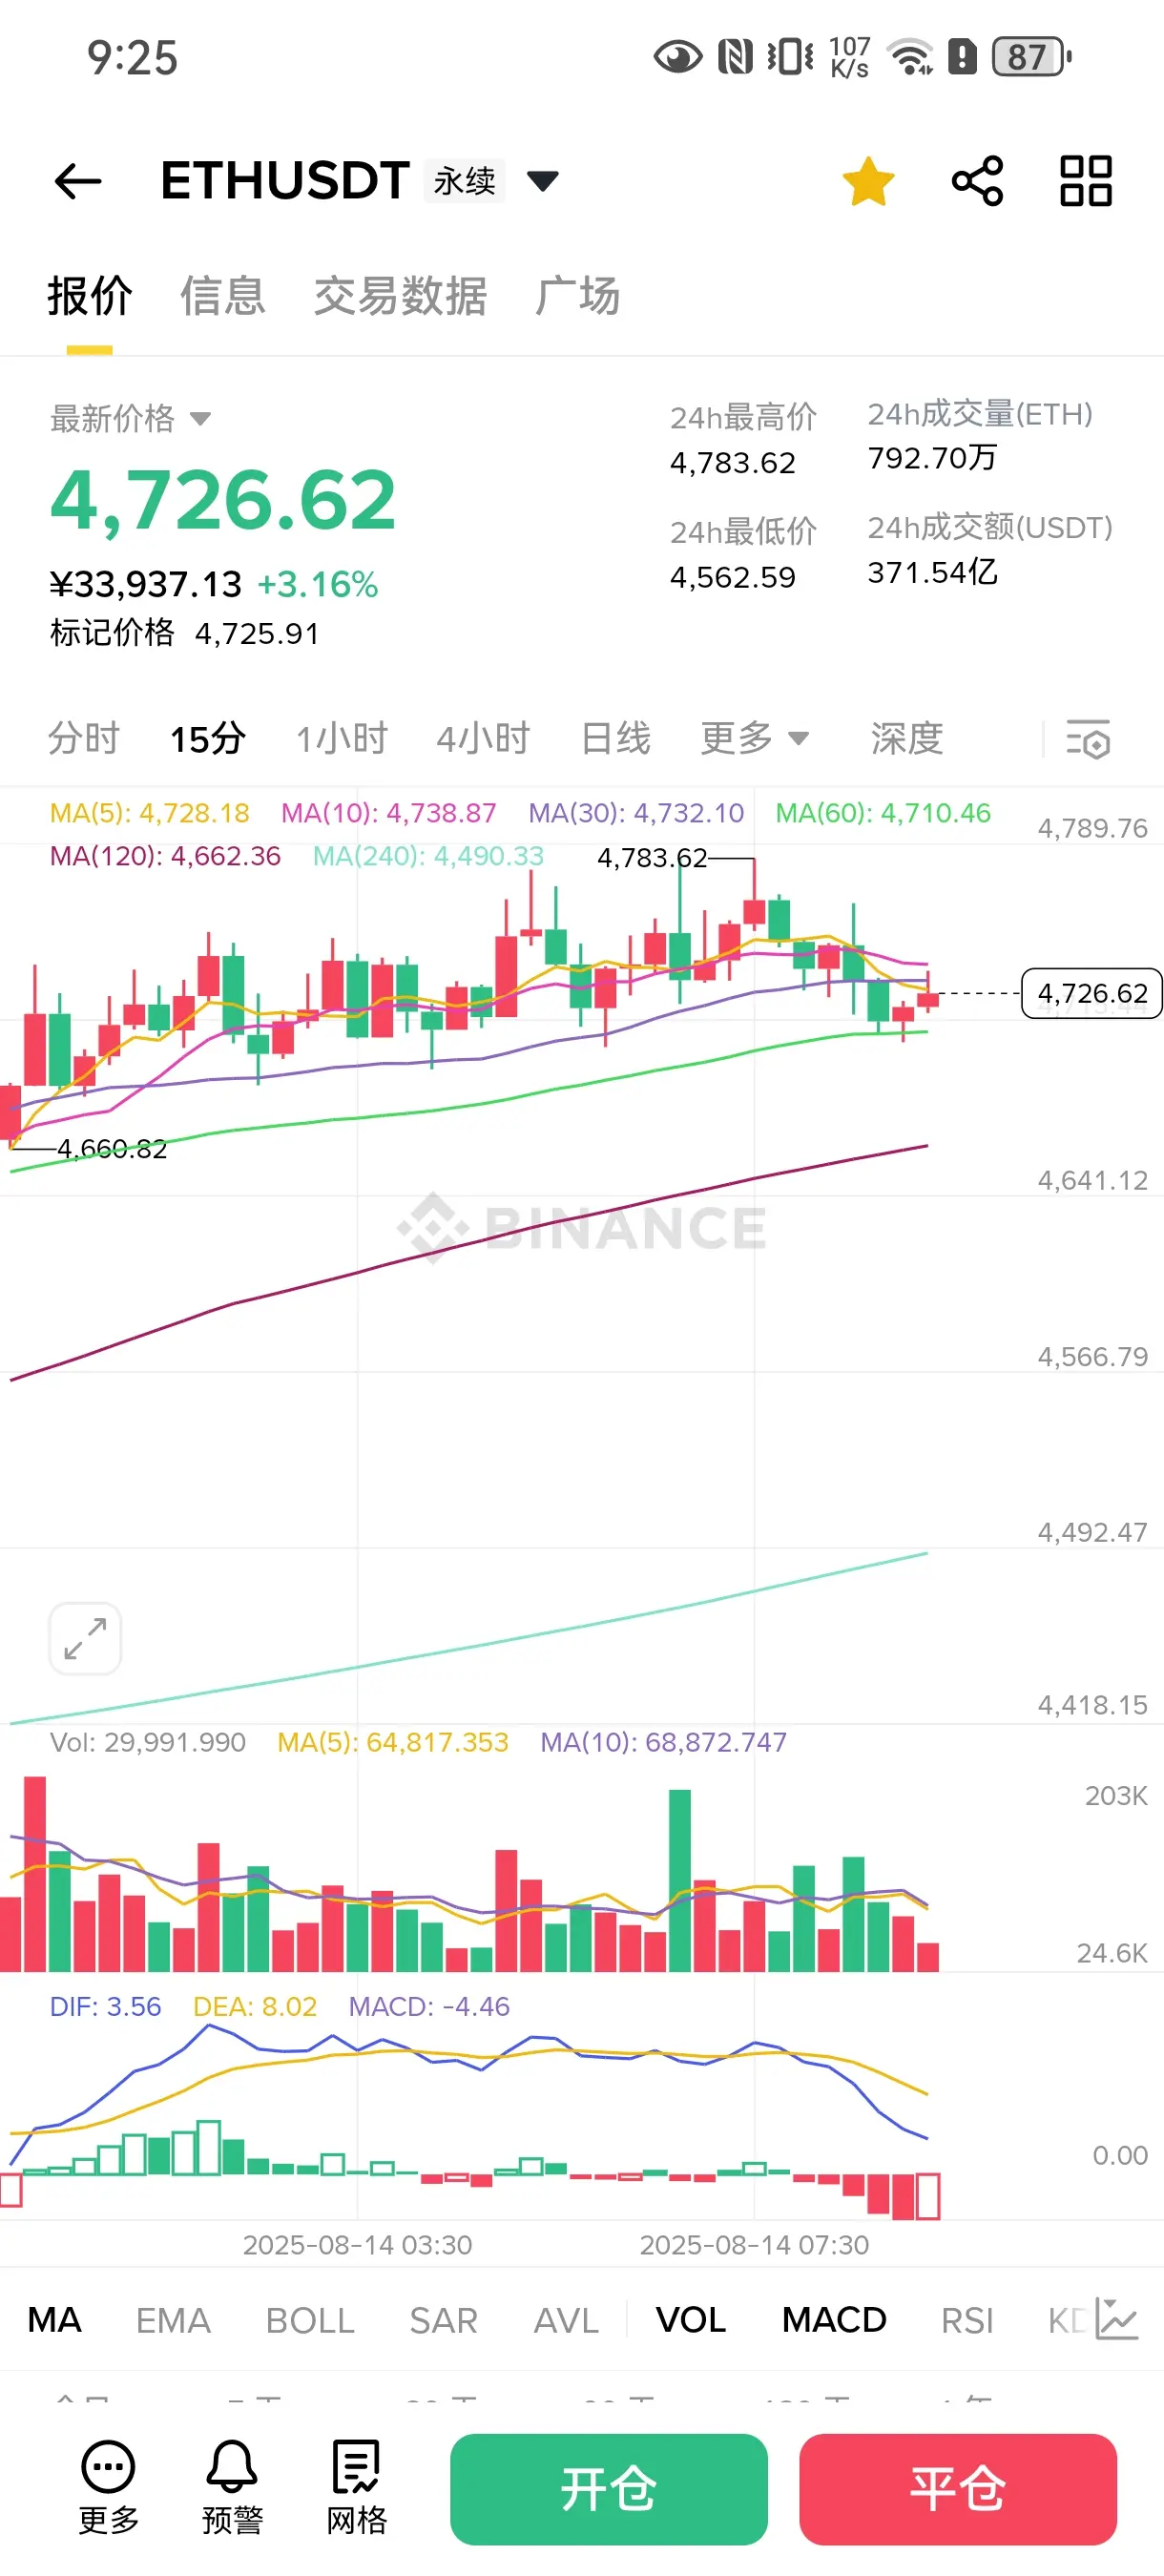
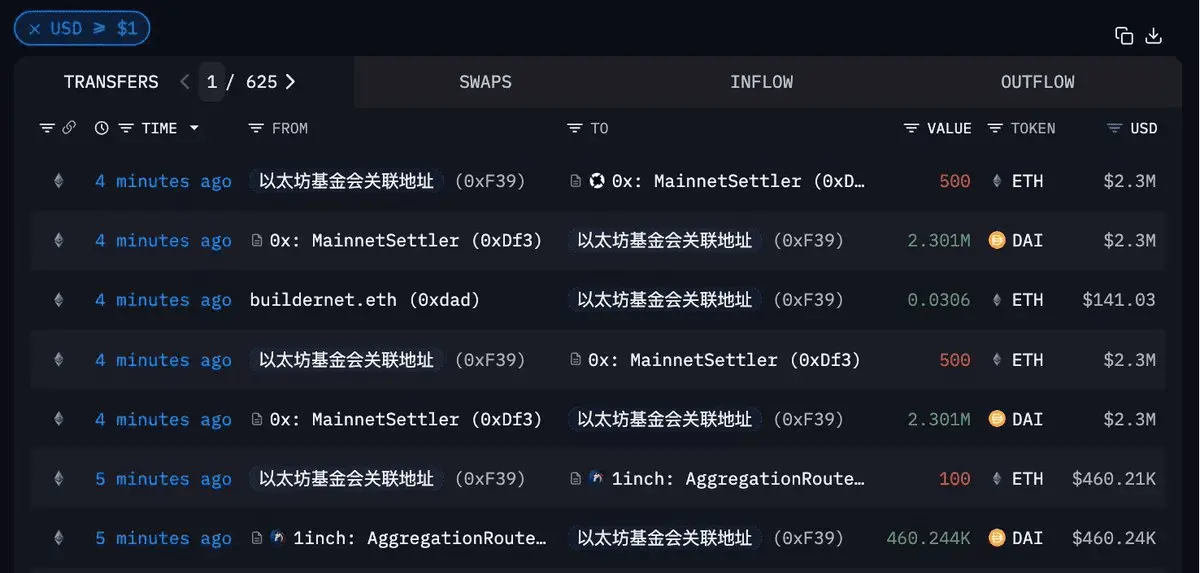
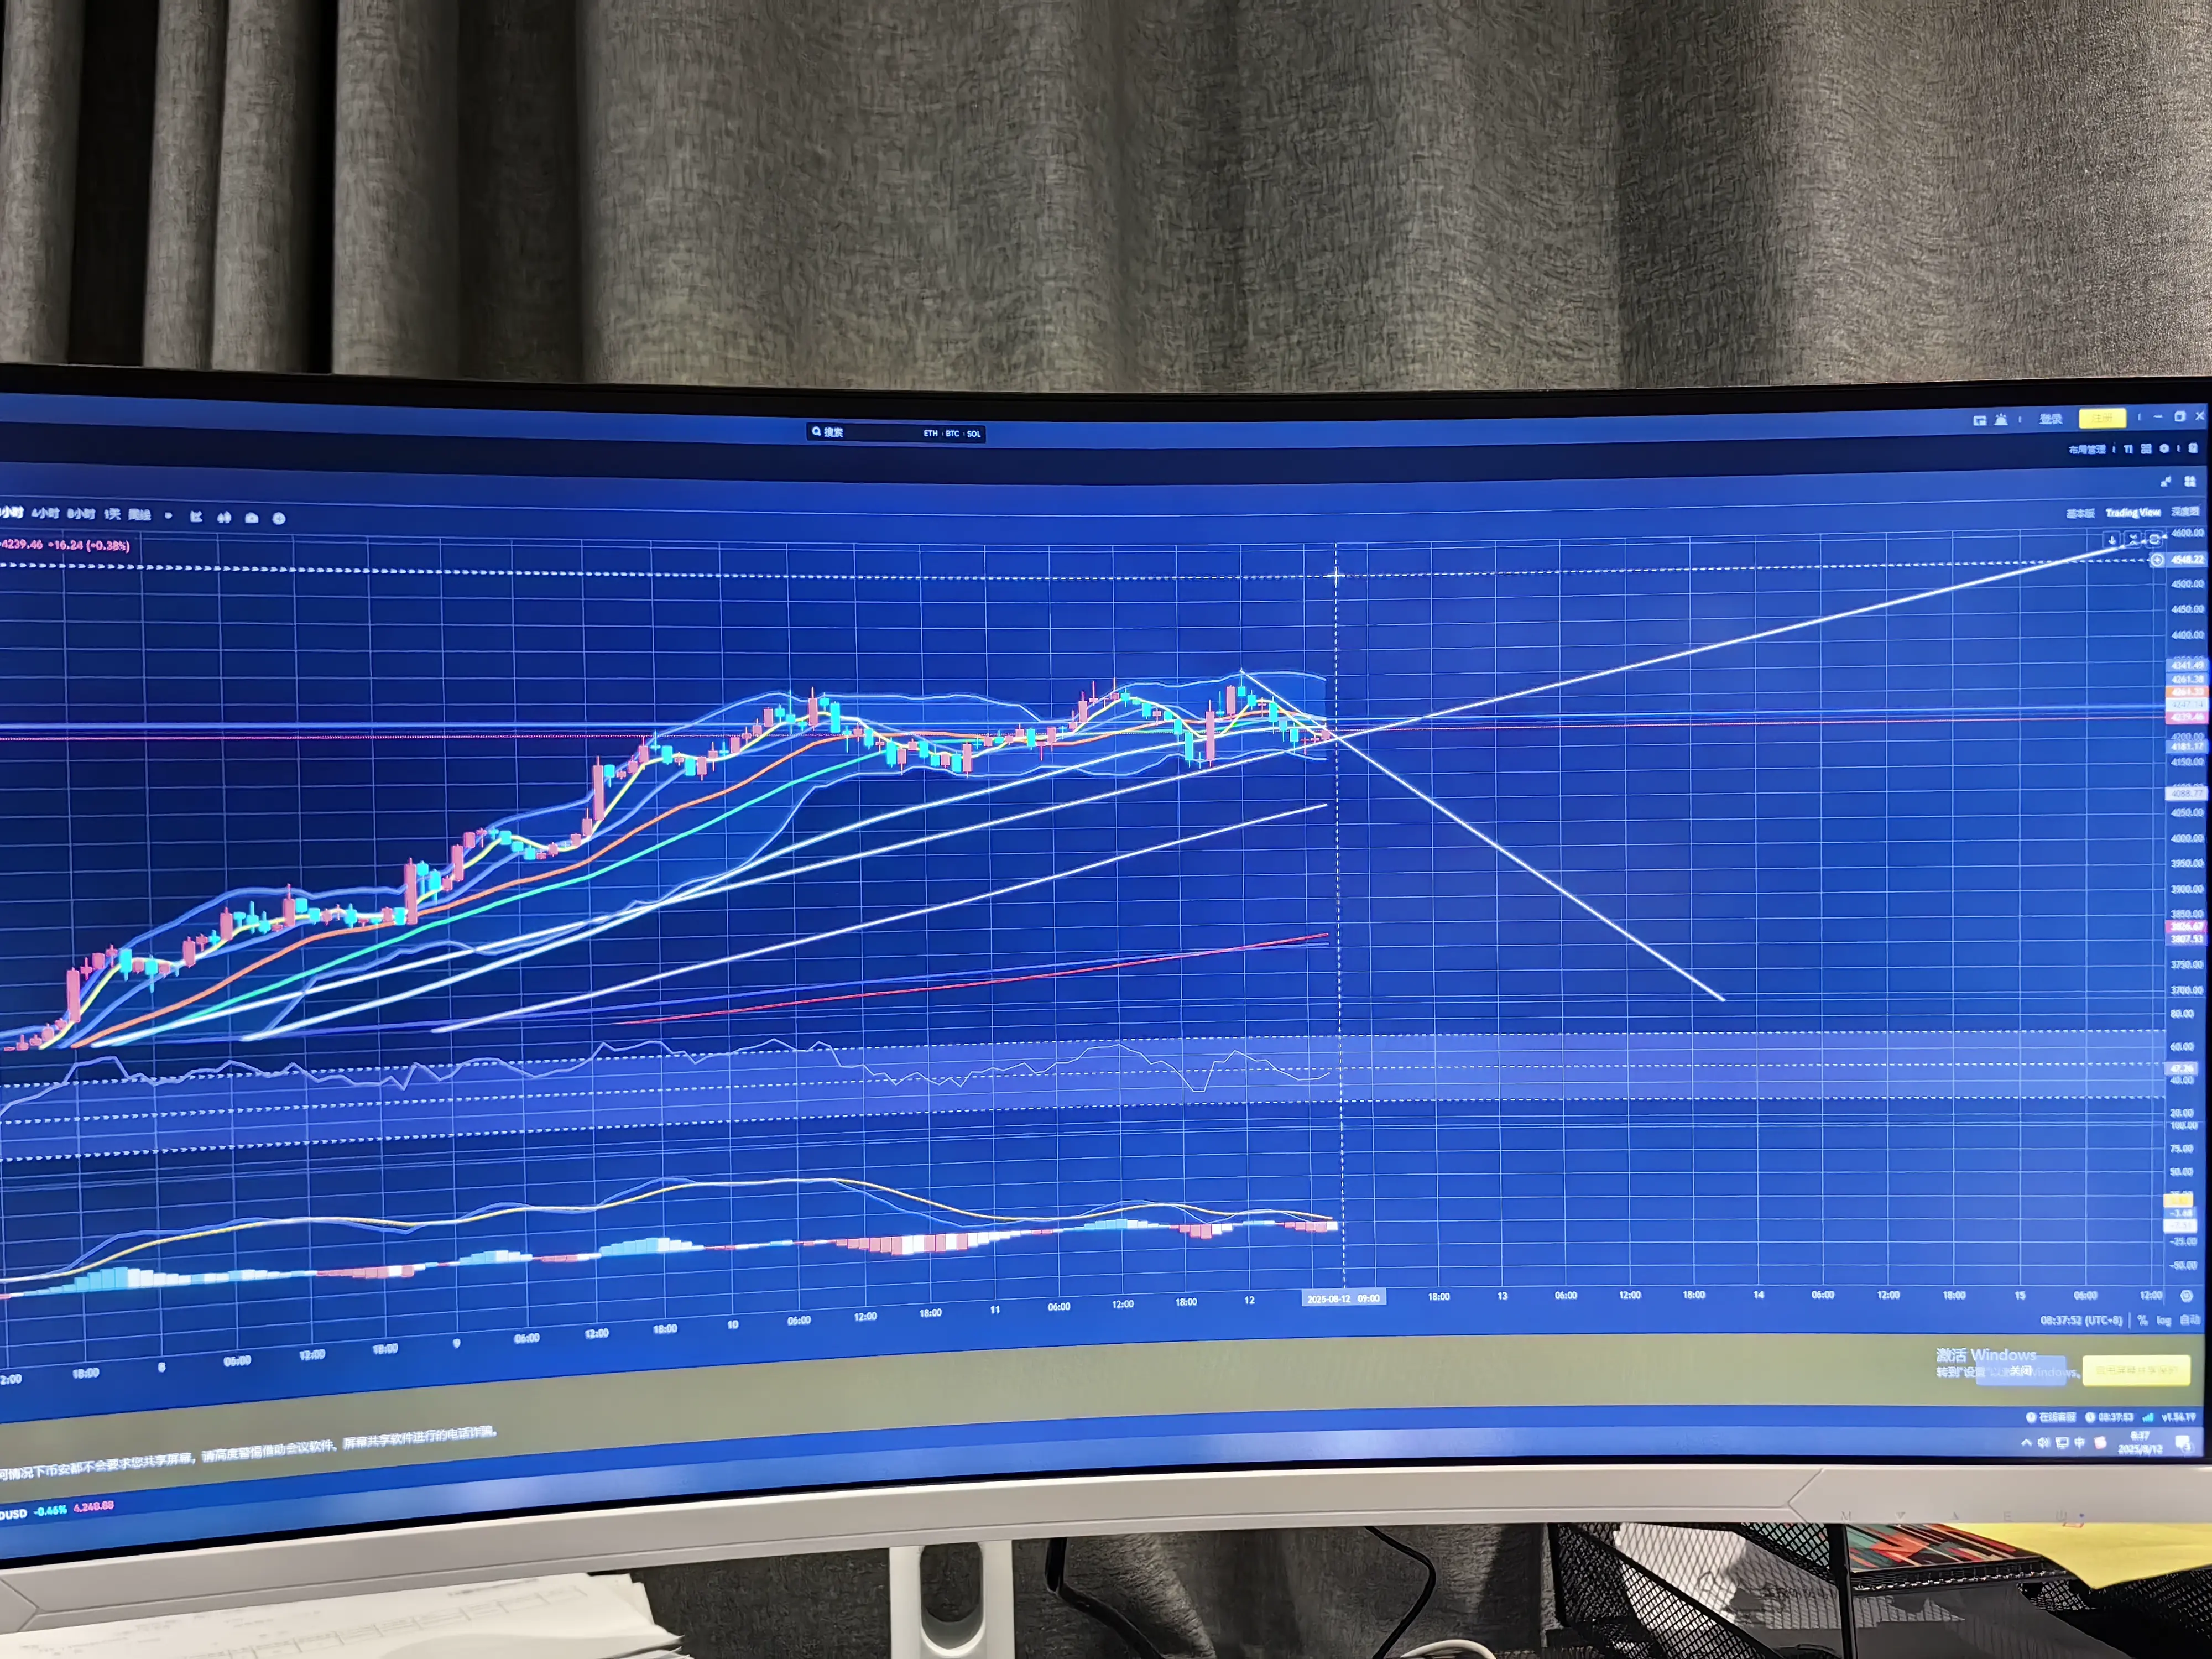
Hôm qua, khi xem lại, Ethereum hôm qua đã giảm từ mức cao nhất 4521 vào buổi sáng xuống còn 4224, khoảng cách gần 300 điểm, khiến nhiều người bị thanh lý, nhưng sau khi ổn định tại mức 4224, nó lại tăng lên 4343, cho thấy phe mua có sự bố trí sâu ở khu vực này. Hiện tại, động lực vẫn đang thuộc về phe bán, những tin tức hôm qua không có thông tin xấu rõ rệt nào, ngược lại, một số tin tức tốt lại xuất hiện liên tục, cho thấy đợt giảm giá này chỉ là một số chủ lực và vốn đồng thời chốt lời ở mức cao, gom hàng ở mức thấp. Tổng thể thị trường vẫn cần chờ đợi phát biểu của Chủ tịch Cục Dự
Xem bản gốcHôm qua, khi xem lại, Ethereum hôm qua đã giảm từ mức cao nhất 4521 vào buổi sáng xuống còn 4224, khoảng cách gần 300 điểm, khiến nhiều người bị thanh lý, nhưng sau khi ổn định tại mức 4224, nó lại tăng lên 4343, cho thấy phe mua có sự bố trí sâu ở khu vực này. Hiện tại, động lực vẫn đang thuộc về phe bán, những tin tức hôm qua không có thông tin xấu rõ rệt nào, ngược lại, một số tin tức tốt lại xuất hiện liên tục, cho thấy đợt giảm giá này chỉ là một số chủ lực và vốn đồng thời chốt lời ở mức cao, gom hàng ở mức thấp. Tổng thể thị trường vẫn cần chờ đợi phát biểu của Chủ tịch Cục Dự