США вмешиваются в конфликт между Израилем и Палестиной, геополитика усиливает давление на снижение цены BTC, следовать поддержке в 100000 долларов (06.16~06.22)
Информация, мнения и суждения о рынках, проектах, валютах и т.д., упомянутые в этом отчете, предназначены только для справки и не являются инвестиционным советом.
На этой неделе криптоактивы испытали тройное переплетение: "институциональные средства поддержки, повышение осторожности в деривативах, мгновенное усиление геополитических рисков".
BTC продолжает тестировать диапазон 102000-109000 долларов, и в выходные дни из-за атаки США на иранские ядерные объекты произошел краткосрочный панический спад, после чего часть потерь была восстановлена.
Внутренняя структурная сила крипторынка остается целостной, что является важной поддержкой для стабильных цен, но из-за усиливающихся геополитических конфликтов краткосрочные трейдеры произвели понижение цен на BTC.
В дальнейшем, при стабильной внутренней структуре, последующее движение BTC полностью зависит от того, будет ли продолжаться эскалация конфликта между Ираном и Израилем, например, если Иран начнет поставлять оружие американским военным базам, кораблям и даже заблокирует Ормузский пролив. Если конфликт постепенно возобновится, с большой вероятностью BTC вернется к уровню 105000 долларов.
Политика, макрофинансовые и экономические данные
На этой неделе конфликт между Израилем и Палестиной накаляется по спирали.
С 16 по 18 июня Израиль продолжал проводить "хирургические" воздушные удары, нацеливаясь на позиции ракет в Иране и командные центры шиитских ополченцев; Иран в ответ произвел ракетные и беспилотные удары, что привело к увеличению напряженности в регионе. Рынок незамедлительно вошел в режим защиты: цена на нефть марки Brent за неделю выросла почти на 7%, однажды преодолев отметку в 78 долларов; золото также выросло, достигнув максимума в 33452,37 долларов за унцию.
19 июня Белый дом впервые публично заявил о том, что "оценивает военные варианты", что знаменует собой критическую точку, в которой США переходят от координации за кулисами к открытому вмешательству. В день публикации новости фьючерсы на нефть Brent снова выросли на 2,8%, составив 78,85 долларов, что является новым пятимесячным максимумом; индекс волатильности VIX увеличился, в то время как доходность американских облигаций показала понижающуюся тенденцию в условиях поиска безопасных активов.
Кратковременное облегчение появилось 20 июня — рынок предполагал, что Вашингтон может закончить дело дополнительными санкциями, а не силой, что привело к небольшому падению цен на нефть и техническому отскоку мировых фондовых индексов.
Однако всего через день этот оптимизм по поводу "санкционного заменяющего удара" был полностью разбит: президент США Дональд Трамп отдал приказ в ночное время по восточному времени США 21 июня, три B-2 стелс-бомбардировщика с GBU-57 "гигантскими буровыми бомбами" нанесли точечные удары по трем объектам по обогащению урана в Иране: Фордо, Натанзе и Исфахане. Трамп в телевизионном обращении заявил, что "ключевые основные возможности были сброшены до нуля", намекая на то, что если Иран готов к переговорам, действия могут прекратиться.
Этот шаг немедленно вызвал резкие дипломатические потрясения. Генеральный секретарь ООН Антониу Гутерриш охарактеризовал ситуацию как «опасную как яичная скорлупа», в то время как Европейский Союз и Великобритания одновременно осудили ядерные амбиции Ирана и призвали все стороны к сдержанности. Министр иностранных дел Ирана обвинил США в «открытом нарушении Устава ООН», поклявшись предпринять «равноценные или асимметричные ответные меры», и заявил, что не исключает «выборочной блокады» в Ормузском проливе. Затем парламент Ирана принял резолюцию о возможности закрытия Ормузского пролива (что повлияет на 20% мировых поставок нефти), а окончательное решение будет принимать Высший совет национальной безопасности Ирана.
Из-за того, что воздушные удары произошли в выходные дни, когда финансовые рынки закрыты, ценообразование на основных финансовых рынках будет известно в понедельник, но деривативы и офшорные сделки уже подали предварительные сигналы: ETF на энергетику и военную промышленность на ночных торгах выросли; объем открытых позиций по опционам на нефть CME значительно увеличился на уровне исполнения выше 90 долларов; в то время как высокорисковые криптоактивы первым делом столкнулись с давлением на продажу, BTC упал примерно на 1,14%, а ETH в течение дня упал более чем на 2,96%.
В прошлой недельной отчетности мы указали: краткосрочная динамика BTC зависит от прогресса в «геополитических конфликтах». Если конфликты усугубятся или даже перерастут в эскалацию, рискованные активы, включая BTC, останутся под давлением и могут продолжить снижение; если конфликт утихнет, то акционные активы могут постепенно восстановить свои потери.
Прямое вмешательство США на этой неделе привело к эскалации конфликта, что способствовало снижению BTC на 4,36% за неделю, составив 4602,38 долларов. Если последующие ответные действия Ирана будут включать в себя угрозу поставкам на базы США или "блокировку" Ормузского пролива, это еще больше повлияет на снижение цен на глобальном фондовом рынке и криптоактивах.
На этой неделе события подвели ситуацию на Ближнем Востоке к "контролируемому противостоянию" и "эскалации через代理人" в серую зону, и рынок вошел в типичную модель "инфляция на нефть — защитные активы США — коррекция технологий — спрос на драгоценные металлы". Если в ближайшие несколько недель Иран будет ограничен в ответных действиях из-за внутренней политики и военных возможностей, то рынок, возможно, будет переваривать высокие колебания; но если конфликт перерастет в морские энергетические маршруты или на базы американских войск, то масштабы и темпы перепродажи глобальных активов значительно возрастут.
Исторические данные показывают, что BTC в начале геополитических кризисов часто сначала откатывается, а затем восстанавливается с слабой отрицательной корреляцией с золотом; однако, если конфликт перерастет в двойное давление на глобальную ликвидность и стоимость капитала, чувствительность биткойна и эфириума значительно возрастет.
Криптовалютный рынок
На этой неделе криптоактивы испытали "три взаимосвязанные фактора: поддержка институциональных средств, рост осторожности по деривативам и мгновенное усиление геополитических рисков". BTC продолжает тестировать диапазон 102000-109000 долларов и на выходных испытал кратковременное паническое падение после атаки США на ядерные объекты Ирана, после чего частично восстановился.
В начале недели ожидания «контролируемости» конфликта между Израилем и Палестиной привели к небольшому восстановлению: BTC достиг максимума в 109000 долларов, а чистый приток средств в биткойн-ETF продолжался на протяжении восьми торговых дней. Эти данные по денежным потокам обеспечили ключевую поддержку для цены на фоне макроэкономического шума. На фоне охлаждения капитала на рынке институциональный спрос стал основной силой, удерживающей цену BTC выше 100000 долларов.
Затем, результаты FOMC, опубликованные 19 июня, «остались на месте + замедление точечной диаграммы», не нарушили волатильный ритм BTC, но рынок фьючерсов показывает, что хеджирование увеличивается.
По данным, опубликованным в пятницу после торгов, ETF на ETH зафиксировал наибольший чистый отток за один день с июня (11,3 миллиона долларов), что вызвало последовательное сокращение позиций институциональных инвесторов и цепную реакцию по снижению кредитного плеча. Котировка ETH в долларах США на некоторое время резко упала до 2372 долларов, объем торгов увеличился, что также привело к коррекции таких высокобета активов, как SOL и DOGE.
20 июня в американскую торговую сессию серия высоких рычагов на рынке привела к быстрому падению BTC ниже 103000 долларов, при этом более 90% позиций были длинными; ETH, SOL и другие упали на 6-9%. Этот инцидент "мгновенного уничтожения" подтвердил уязвимость чрезмерного рычага на стороне деривативов и ознаменовал первую крупномасштабную системную ликвидацию на рынке после быстрого роста в мае.
В выходные рисковая волна достигла пика в восточное время США 21-22 июня: сообщение о точечном ударе американского B-2 по трем объектам по обогащению урана в Иране разрушило выходной ликвидный вакуум. Крипторынок, как единственный класс активов с реальной торговлей 24/7, BTC на время упал ниже 100 000 долларов, но закрылся с падением на 1,14%, продемонстрировав относительно сильные результаты, в то время как ETH, после двух дней падения почти на 10%, снова упал на 2,96%, что показывает, что ликвидность высокорисковых активов крайне хрупка.
С точки зрения технических индикаторов, геополитические конфликты привели к тому, что BTC временно упал ниже первой восходящей трендовой линии, но все еще находится в диапазоне 90000 ~ 110000 долларов. Мы считаем, что структурированное напряжение на рынке сохраняется в полной мере, изменения в поддержке капитала незначительны, и понижение цены BTC на этой неделе вызвано паническими настроениями, вызванными эскалацией геополитического конфликта. Если конфликт снова обострится, это влияние постепенно исчезнет, но если конфликт продолжит обостряться, это станет испытанием для ключевых уровней поддержки в 100000 и 90000 долларов.
Ввод и вывод средств
После большого ралли в апреле и мае, приток средств начал дифференцироваться: объем средств в стабильных монетах стал уменьшаться, в то время как объем средств в BTC Spot ETF оставался относительно сильным и стабильным.
На этой неделе приток средств в BTC Spot ETF составил 1,022 миллиарда долларов, что значительно ниже 1,384 миллиарда долларов на прошлой неделе, но все же остается на высоком уровне. Однако на следующей неделе эти данные могут столкнуться с серьезными вызовами, если геополитические конфликты продолжат охлаждать фондовый рынок США, приток средств в BTC Spot ETF, вероятно, не сможет продемонстрировать независимую динамику.
На прошлой неделе в канал стабильных монет было вложено 1,273 миллиарда, а на этой неделе наблюдается вывод в 132 миллиона. Эта быстрая остывшая ситуация соответствует тенденциям, которые мы наблюдали на рынке контрактов и рынке кредитования.
На этой неделе ETH Spot ETH составил 40,77 миллиона долларов, в первой половине недели объем притока сократился, а к пятнице произошел отток более 100 миллионов долларов. Снижение объема притока ETH может оказать давление на высокобета активы. Если произойдет резкое падение, это может нанести значительный ущерб рынку.
Давление на продажу и распродажа
На фоне затягивания снижения процентных ставок и геополитических пиков, цена BTC удерживается на высоком уровне от 10 до 12 долларов, а решающая сила исходит от институционального распределения и структурного напряжения на рынке.
На этой неделе длинные позиции продолжили увеличиваться на 28920 монет, короткие позиции продолжили уменьшаться на 24650 монет, а запасы на централизованных биржах продолжили сокращаться. Из-за панических распродаж и ослабления спекулятивного интереса объем вывода из бирж на этой неделе значительно сократился до 1555.9 монет.
Данные могут указывать на то, что уверенность долгосрочных держателей в BTC продолжает расти, но энтузиазм краткосрочных трейдеров быстро угасает, и краткосрочное ценообразование BTC определяется как краткосрочными трейдерами на площадке, так и деньгами, поступающими через BTC Spot ETF. В настоящее время обе стороны демонстрируют охлаждение. Если конфликт между Израилем и Палестиной будет быстро разрешен, BTC может выйти из危ности и вернуться к уровню 105000. Если же ситуация ухудшится, вероятнее всего, он упадет ниже уровня 100000, даже может протестировать 90000 (вероятность низкая).
EMC Labs считает, что логика долгосрочного ценового движения BTC не изменилась, если только конфликт между Израилем и Ираном не перерастет в региональную войну с вмешательством США.
Периодические индикаторы
Согласно eMerge Engine, показатели EMC BTC Cycle Metrics равны 0.625, находятся в восходящем тренде.
Лаборатории EMC
EMC Labs (ЭМC Лаборатории) была основана инвесторами в криптоактивы и дата-учеными в апреле 2023 года. Она сосредоточена на исследовании блокчейн-индустрии и инвестициях во вторичный рынок Crypto, с акцентом на предвидение, понимание и добычу данных как на основные конкурентные преимущества, стремясь участвовать в процветающей блокчейн-индустрии через исследования и инвестиции, способствуя тому, чтобы блокчейн и криптоактивы приносили пользу человечеству.
На этой странице может содержаться сторонний контент, который предоставляется исключительно в информационных целях (не в качестве заявлений/гарантий) и не должен рассматриваться как поддержка взглядов компании Gate или как финансовый или профессиональный совет. Подробности смотрите в разделе «Отказ от ответственности» .


США вмешиваются в конфликт между Израилем и Палестиной, геополитика усиливает давление на снижение цены BTC, следовать поддержке в 100000 долларов (06.16~06.22)
! Изображение
Информация, мнения и суждения о рынках, проектах, валютах и т.д., упомянутые в этом отчете, предназначены только для справки и не являются инвестиционным советом.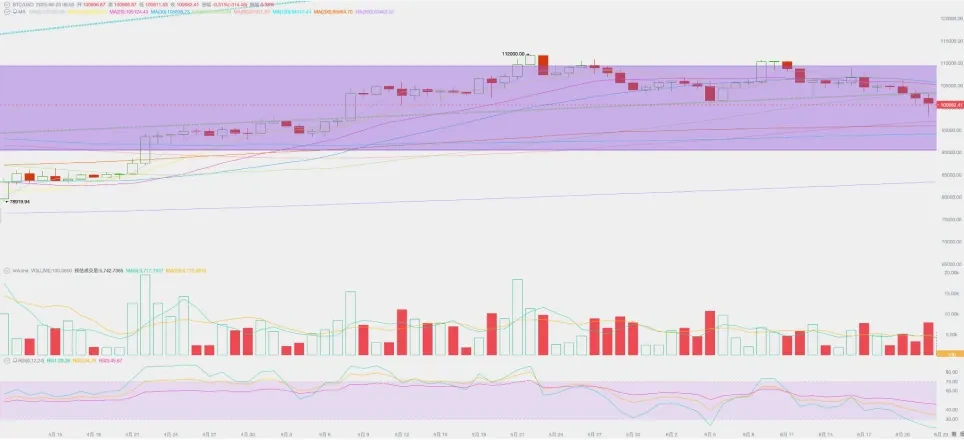
На этой неделе криптоактивы испытали тройное переплетение: "институциональные средства поддержки, повышение осторожности в деривативах, мгновенное усиление геополитических рисков".
BTC продолжает тестировать диапазон 102000-109000 долларов, и в выходные дни из-за атаки США на иранские ядерные объекты произошел краткосрочный панический спад, после чего часть потерь была восстановлена.
Внутренняя структурная сила крипторынка остается целостной, что является важной поддержкой для стабильных цен, но из-за усиливающихся геополитических конфликтов краткосрочные трейдеры произвели понижение цен на BTC.
В дальнейшем, при стабильной внутренней структуре, последующее движение BTC полностью зависит от того, будет ли продолжаться эскалация конфликта между Ираном и Израилем, например, если Иран начнет поставлять оружие американским военным базам, кораблям и даже заблокирует Ормузский пролив. Если конфликт постепенно возобновится, с большой вероятностью BTC вернется к уровню 105000 долларов.
Политика, макрофинансовые и экономические данные
На этой неделе конфликт между Израилем и Палестиной накаляется по спирали.
С 16 по 18 июня Израиль продолжал проводить "хирургические" воздушные удары, нацеливаясь на позиции ракет в Иране и командные центры шиитских ополченцев; Иран в ответ произвел ракетные и беспилотные удары, что привело к увеличению напряженности в регионе. Рынок незамедлительно вошел в режим защиты: цена на нефть марки Brent за неделю выросла почти на 7%, однажды преодолев отметку в 78 долларов; золото также выросло, достигнув максимума в 33452,37 долларов за унцию.
19 июня Белый дом впервые публично заявил о том, что "оценивает военные варианты", что знаменует собой критическую точку, в которой США переходят от координации за кулисами к открытому вмешательству. В день публикации новости фьючерсы на нефть Brent снова выросли на 2,8%, составив 78,85 долларов, что является новым пятимесячным максимумом; индекс волатильности VIX увеличился, в то время как доходность американских облигаций показала понижающуюся тенденцию в условиях поиска безопасных активов.
Кратковременное облегчение появилось 20 июня — рынок предполагал, что Вашингтон может закончить дело дополнительными санкциями, а не силой, что привело к небольшому падению цен на нефть и техническому отскоку мировых фондовых индексов.
Однако всего через день этот оптимизм по поводу "санкционного заменяющего удара" был полностью разбит: президент США Дональд Трамп отдал приказ в ночное время по восточному времени США 21 июня, три B-2 стелс-бомбардировщика с GBU-57 "гигантскими буровыми бомбами" нанесли точечные удары по трем объектам по обогащению урана в Иране: Фордо, Натанзе и Исфахане. Трамп в телевизионном обращении заявил, что "ключевые основные возможности были сброшены до нуля", намекая на то, что если Иран готов к переговорам, действия могут прекратиться.
Этот шаг немедленно вызвал резкие дипломатические потрясения. Генеральный секретарь ООН Антониу Гутерриш охарактеризовал ситуацию как «опасную как яичная скорлупа», в то время как Европейский Союз и Великобритания одновременно осудили ядерные амбиции Ирана и призвали все стороны к сдержанности. Министр иностранных дел Ирана обвинил США в «открытом нарушении Устава ООН», поклявшись предпринять «равноценные или асимметричные ответные меры», и заявил, что не исключает «выборочной блокады» в Ормузском проливе. Затем парламент Ирана принял резолюцию о возможности закрытия Ормузского пролива (что повлияет на 20% мировых поставок нефти), а окончательное решение будет принимать Высший совет национальной безопасности Ирана.
Из-за того, что воздушные удары произошли в выходные дни, когда финансовые рынки закрыты, ценообразование на основных финансовых рынках будет известно в понедельник, но деривативы и офшорные сделки уже подали предварительные сигналы: ETF на энергетику и военную промышленность на ночных торгах выросли; объем открытых позиций по опционам на нефть CME значительно увеличился на уровне исполнения выше 90 долларов; в то время как высокорисковые криптоактивы первым делом столкнулись с давлением на продажу, BTC упал примерно на 1,14%, а ETH в течение дня упал более чем на 2,96%.
В прошлой недельной отчетности мы указали: краткосрочная динамика BTC зависит от прогресса в «геополитических конфликтах». Если конфликты усугубятся или даже перерастут в эскалацию, рискованные активы, включая BTC, останутся под давлением и могут продолжить снижение; если конфликт утихнет, то акционные активы могут постепенно восстановить свои потери.
Прямое вмешательство США на этой неделе привело к эскалации конфликта, что способствовало снижению BTC на 4,36% за неделю, составив 4602,38 долларов. Если последующие ответные действия Ирана будут включать в себя угрозу поставкам на базы США или "блокировку" Ормузского пролива, это еще больше повлияет на снижение цен на глобальном фондовом рынке и криптоактивах.
На этой неделе события подвели ситуацию на Ближнем Востоке к "контролируемому противостоянию" и "эскалации через代理人" в серую зону, и рынок вошел в типичную модель "инфляция на нефть — защитные активы США — коррекция технологий — спрос на драгоценные металлы". Если в ближайшие несколько недель Иран будет ограничен в ответных действиях из-за внутренней политики и военных возможностей, то рынок, возможно, будет переваривать высокие колебания; но если конфликт перерастет в морские энергетические маршруты или на базы американских войск, то масштабы и темпы перепродажи глобальных активов значительно возрастут.
Исторические данные показывают, что BTC в начале геополитических кризисов часто сначала откатывается, а затем восстанавливается с слабой отрицательной корреляцией с золотом; однако, если конфликт перерастет в двойное давление на глобальную ликвидность и стоимость капитала, чувствительность биткойна и эфириума значительно возрастет.
Криптовалютный рынок
На этой неделе криптоактивы испытали "три взаимосвязанные фактора: поддержка институциональных средств, рост осторожности по деривативам и мгновенное усиление геополитических рисков". BTC продолжает тестировать диапазон 102000-109000 долларов и на выходных испытал кратковременное паническое падение после атаки США на ядерные объекты Ирана, после чего частично восстановился.
В начале недели ожидания «контролируемости» конфликта между Израилем и Палестиной привели к небольшому восстановлению: BTC достиг максимума в 109000 долларов, а чистый приток средств в биткойн-ETF продолжался на протяжении восьми торговых дней. Эти данные по денежным потокам обеспечили ключевую поддержку для цены на фоне макроэкономического шума. На фоне охлаждения капитала на рынке институциональный спрос стал основной силой, удерживающей цену BTC выше 100000 долларов.
Затем, результаты FOMC, опубликованные 19 июня, «остались на месте + замедление точечной диаграммы», не нарушили волатильный ритм BTC, но рынок фьючерсов показывает, что хеджирование увеличивается.
По данным, опубликованным в пятницу после торгов, ETF на ETH зафиксировал наибольший чистый отток за один день с июня (11,3 миллиона долларов), что вызвало последовательное сокращение позиций институциональных инвесторов и цепную реакцию по снижению кредитного плеча. Котировка ETH в долларах США на некоторое время резко упала до 2372 долларов, объем торгов увеличился, что также привело к коррекции таких высокобета активов, как SOL и DOGE.
20 июня в американскую торговую сессию серия высоких рычагов на рынке привела к быстрому падению BTC ниже 103000 долларов, при этом более 90% позиций были длинными; ETH, SOL и другие упали на 6-9%. Этот инцидент "мгновенного уничтожения" подтвердил уязвимость чрезмерного рычага на стороне деривативов и ознаменовал первую крупномасштабную системную ликвидацию на рынке после быстрого роста в мае.
В выходные рисковая волна достигла пика в восточное время США 21-22 июня: сообщение о точечном ударе американского B-2 по трем объектам по обогащению урана в Иране разрушило выходной ликвидный вакуум. Крипторынок, как единственный класс активов с реальной торговлей 24/7, BTC на время упал ниже 100 000 долларов, но закрылся с падением на 1,14%, продемонстрировав относительно сильные результаты, в то время как ETH, после двух дней падения почти на 10%, снова упал на 2,96%, что показывает, что ликвидность высокорисковых активов крайне хрупка.
С точки зрения технических индикаторов, геополитические конфликты привели к тому, что BTC временно упал ниже первой восходящей трендовой линии, но все еще находится в диапазоне 90000 ~ 110000 долларов. Мы считаем, что структурированное напряжение на рынке сохраняется в полной мере, изменения в поддержке капитала незначительны, и понижение цены BTC на этой неделе вызвано паническими настроениями, вызванными эскалацией геополитического конфликта. Если конфликт снова обострится, это влияние постепенно исчезнет, но если конфликт продолжит обостряться, это станет испытанием для ключевых уровней поддержки в 100000 и 90000 долларов.
Ввод и вывод средств
После большого ралли в апреле и мае, приток средств начал дифференцироваться: объем средств в стабильных монетах стал уменьшаться, в то время как объем средств в BTC Spot ETF оставался относительно сильным и стабильным.
На этой неделе приток средств в BTC Spot ETF составил 1,022 миллиарда долларов, что значительно ниже 1,384 миллиарда долларов на прошлой неделе, но все же остается на высоком уровне. Однако на следующей неделе эти данные могут столкнуться с серьезными вызовами, если геополитические конфликты продолжат охлаждать фондовый рынок США, приток средств в BTC Spot ETF, вероятно, не сможет продемонстрировать независимую динамику.
! Изображение
Статистика входа средств на крипторынок (неделя)
На прошлой неделе в канал стабильных монет было вложено 1,273 миллиарда, а на этой неделе наблюдается вывод в 132 миллиона. Эта быстрая остывшая ситуация соответствует тенденциям, которые мы наблюдали на рынке контрактов и рынке кредитования.
На этой неделе ETH Spot ETH составил 40,77 миллиона долларов, в первой половине недели объем притока сократился, а к пятнице произошел отток более 100 миллионов долларов. Снижение объема притока ETH может оказать давление на высокобета активы. Если произойдет резкое падение, это может нанести значительный ущерб рынку.
Давление на продажу и распродажа
На фоне затягивания снижения процентных ставок и геополитических пиков, цена BTC удерживается на высоком уровне от 10 до 12 долларов, а решающая сила исходит от институционального распределения и структурного напряжения на рынке.
На этой неделе длинные позиции продолжили увеличиваться на 28920 монет, короткие позиции продолжили уменьшаться на 24650 монет, а запасы на централизованных биржах продолжили сокращаться. Из-за панических распродаж и ослабления спекулятивного интереса объем вывода из бирж на этой неделе значительно сократился до 1555.9 монет.
Данные могут указывать на то, что уверенность долгосрочных держателей в BTC продолжает расти, но энтузиазм краткосрочных трейдеров быстро угасает, и краткосрочное ценообразование BTC определяется как краткосрочными трейдерами на площадке, так и деньгами, поступающими через BTC Spot ETF. В настоящее время обе стороны демонстрируют охлаждение. Если конфликт между Израилем и Палестиной будет быстро разрешен, BTC может выйти из危ности и вернуться к уровню 105000. Если же ситуация ухудшится, вероятнее всего, он упадет ниже уровня 100000, даже может протестировать 90000 (вероятность низкая).
EMC Labs считает, что логика долгосрочного ценового движения BTC не изменилась, если только конфликт между Израилем и Ираном не перерастет в региональную войну с вмешательством США.
Периодические индикаторы
Согласно eMerge Engine, показатели EMC BTC Cycle Metrics равны 0.625, находятся в восходящем тренде.
Лаборатории EMC
EMC Labs (ЭМC Лаборатории) была основана инвесторами в криптоактивы и дата-учеными в апреле 2023 года. Она сосредоточена на исследовании блокчейн-индустрии и инвестициях во вторичный рынок Crypto, с акцентом на предвидение, понимание и добычу данных как на основные конкурентные преимущества, стремясь участвовать в процветающей блокчейн-индустрии через исследования и инвестиции, способствуя тому, чтобы блокчейн и криптоактивы приносили пользу человечеству.
Больше информации, пожалуйста, посетите: